Logs
Logs Overview
The Logs page provides a centralized interface where WordPress and PHP errors are collected, categorized, and displayed. All entries are stored in a dedicated database table created by the plugin, optimized for performance with indexed columns, and fully compatible with multisite environments. Users can filter, sort, paginate, and optionally analyze errors using AI-powered insights.
Overview
The dashboard captures system-level events generated throughout your WordPress installation, including PHP errors, database issues, deprecated calls, and general diagnostic messages. This allows administrators and developers to quickly identify issues and monitor site health over time.
You can access this section via:
All DashAI WP → Logs
Data Storage
All logs are written to a private log table inside the WordPress database. This ensures security, performance, and environmental consistency.
Storage Characteristics
Logs are stored in a dedicated table created by the plugin.
Indexed columns ensure fast filtering and pagination.
No logs are written to public files or WordPress directories.
Each record includes severity, message, file path, line number, and timestamp.
Timestamps are displayed using the WordPress timezone configured in Settings → General → Timezone.
Multisite installations receive one log table per site through site-specific table prefixes.
Retention Limits
A maximum of 200 log entries is stored at any time.
Entries older than 90 days are automatically deleted.
Once the storage limit is reached, the oldest logs are removed to create space for new entries.
How Logs Are Captured
The plugin uses a robust capture mechanism to ensure comprehensive logging without impacting performance.
PHP Error Handling
A custom PHP error handler listens to all error levels, including:
Error
Warning
Notice
Deprecated
Database Error Monitoring
The logger listens for:
WordPress database errors
The latest $wpdb error triggered during execution
Shutdown Error Capture
During the shutdown phase, the system checks for:
Fatal shutdown errors
Unhandled exceptions
Late database errors
This ensures high-severity errors are captured even if they occur after output is sent.
Performance Considerations
The logger safely:
Sanitizes messages
Normalizes file paths
Ignores duplicate entries
Truncates oversized error messages
Log Types
The plugin supports the following severity levels:
Error: Critical issues that interrupt execution.
Warning: Non-fatal problems that may cause instability.
Notice: Informational or minor issues.
Deprecated: Usage of functions or features scheduled for removal.
Debug: Verbose or diagnostic messages triggered by developers.
Info: General non-error operational information.
These severities match the plugin’s internal classification and filtering system.
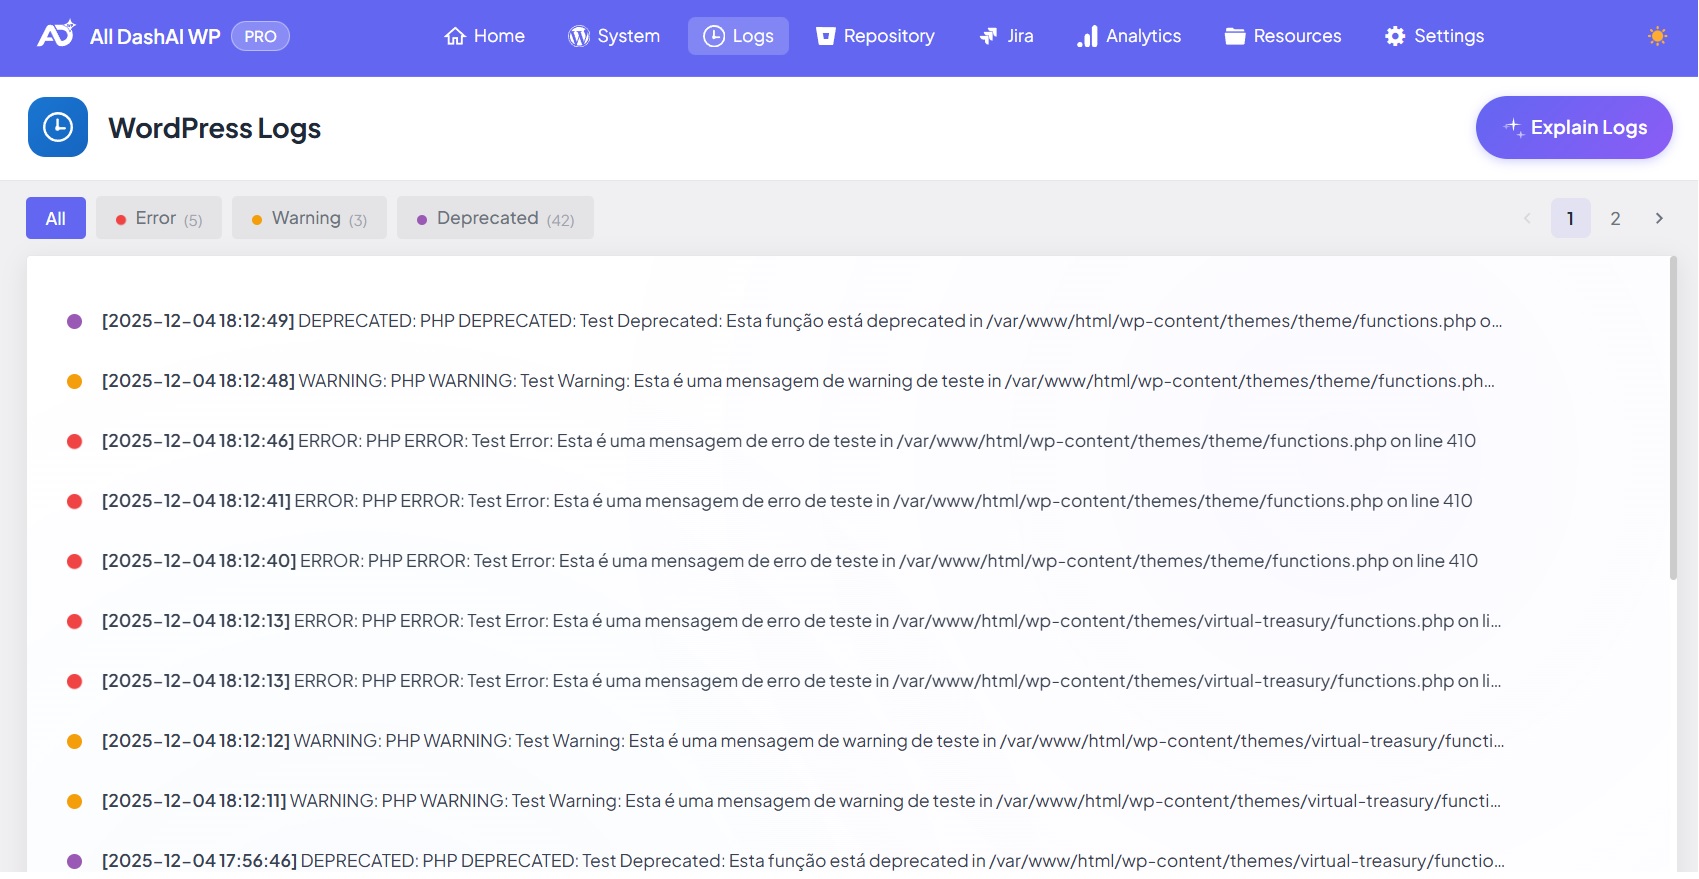
Viewing Logs in the Dashboard
Each log entry displays:
Severity level
Message
File path
Line number
Timestamp (in WordPress timezone)
The interface includes:
Filtering by severity
Pagination (50 entries per page)
AI-assisted explanations (if AI is enabled)
This enables efficient troubleshooting even on installations with large log volumes.
AI Insights (Optional)
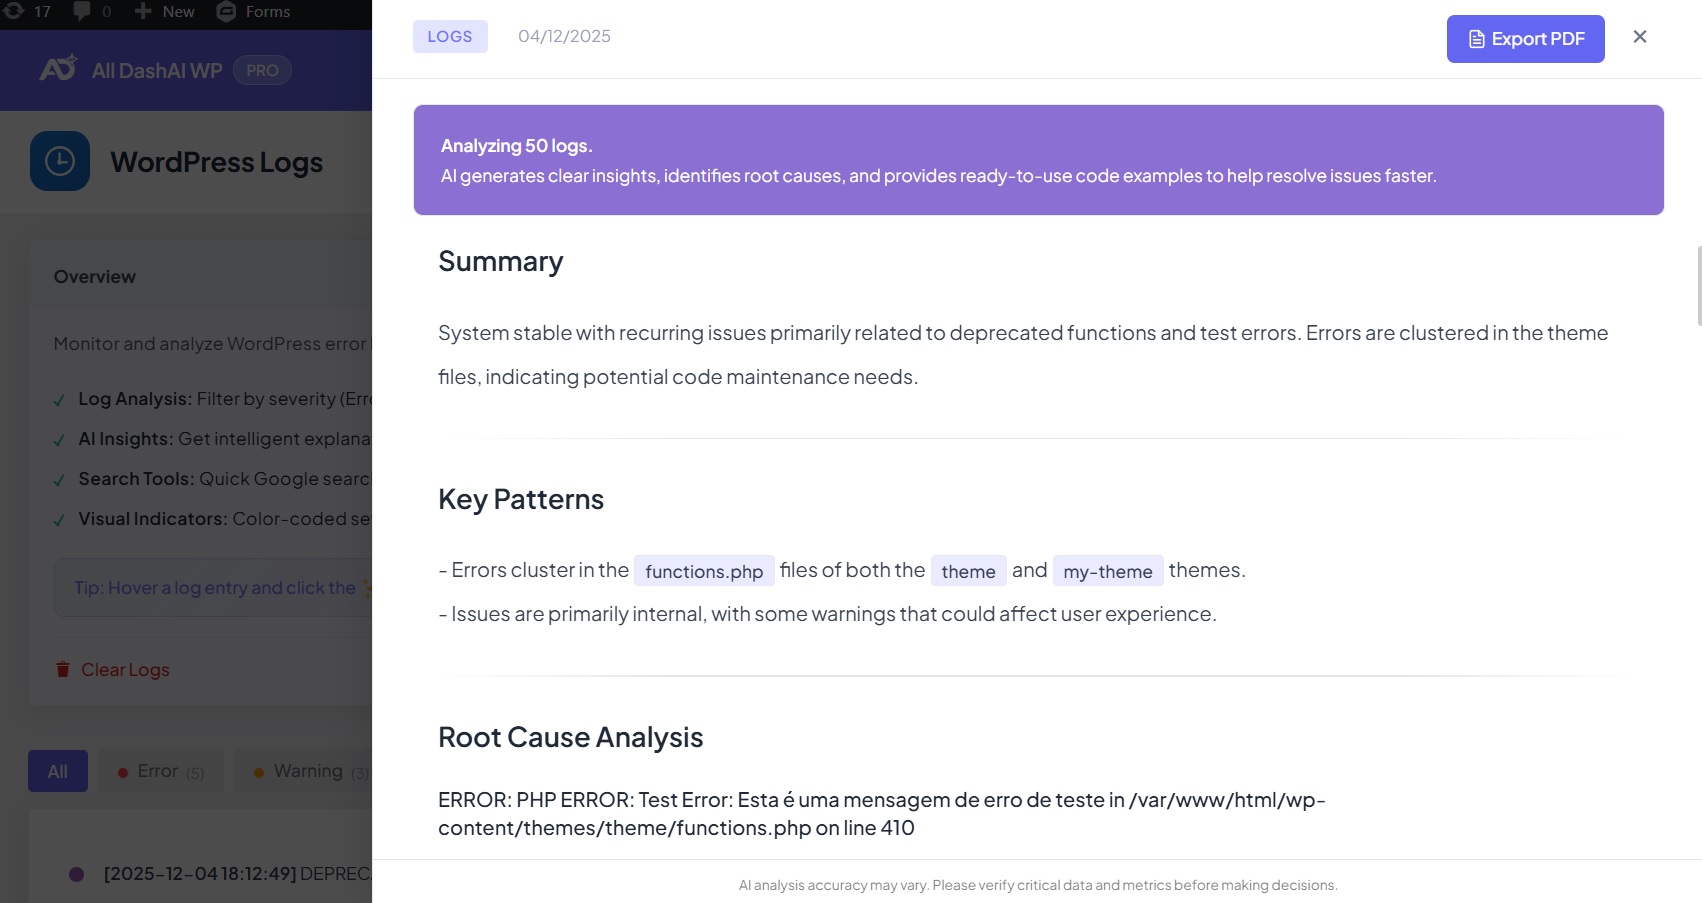
If AI support is activated through an OpenAI API key, the Logs page unlocks advanced capabilities:
Contextual explanations of errors
Recommended fixes
Pattern detection
Severity assessments
Risk evaluation
Suggested next steps
AI analysis helps teams reduce debugging time and better understand complex issues.
PDF Export (PRO)
PRO users can export log analysis reports as PDF documents with custom branding and white-label options.
Multisite Behavior
In multisite networks:
Each site receives its own log table using its own $wpdb->prefix.
Retention rules apply individually for each site.
Network administrators can switch between logs per site.
This ensures isolation of data and accurate reporting.